The 41st match of ICC Men’s T20 World Cup 2024 will be played between United States of America (USA) and South Africa (SA) at Sir Vivian Richards Stadium, Antigua, North Sound, on 19th June 2024 at 8:00 PM IST. If you are interested, you can find more information about the USA vs SA Dream11 Prediction Today Match, USA vs SA Dream11 Team Today, Playing 11s, Pitch Report & USA vs SA Player Stats in this article.
|
Fantasy Tips
|
USA vs SA Dream11 Team Prediction & Match Preview
United States of America lost the recent match against India by 7 wickets. Their top performers were Nitish Kumar, who scored 27 runs off 23 balls, and Steven Taylor, who scored 24 runs off 30 balls. In bowling, Saurabh Netravalkar took 2 wickets and Ali Khan took 1 wicket for United States of America.
For United States of America, Aaron Jones, Andries Gous and Monank Patel are the key batters, while Saurabh Netravalkar, Nosthush Kenjige and Ali Khan are the key bowlers.
South Africa won the last match against Nepal by 1 runs. Their top performers were Reeza Hendricks who scored 43 runs off 49 balls, and Tristan Stubbs, who scored 27 runs off 18 balls. Anrich Nortje took 4 wickets and Tabraiz Shamsi, Aiden Markram took 1 wicket each for South Africa in bowling.
For South Africa, David Miller, Tristan Stubbs and Heinrich Klaasen are the key batters, while Anrich Nortje, Ottniel Baartman and Keshav Maharaj are the key bowlers.
USA vs SA, Pitch Report of Sir Vivian Richards Stadium, Antigua, North Sound
Venue: Sir Vivian Richards Stadium, Antigua, North Sound
Surface Nature – Good for Pacers
Pitch/Venue Average Scores –
- 1st Inn Avg scores – 116
- 2nd Inn Average scores – 109
Win Percentage (Last 7 matches)
- Bat 1st won – 71%
- Bat 2nd won – 29%
Recent matches on this venue
[table “” not found /]USA vs SA Team Squad Analysis & Avg. Fantasy Points/Match
United States of America (USA) Team Squad Analysis & Avg. Points/Match
- Steven Taylor – 24.33 Avg.points
- Shayan Jahangir – 2 Avg.points
- Andries Gous (WK) – 52.67 Avg.points
- Aaron Jones – 67 Avg.points
- Nitish Kumar – 24.67 Avg.points
- Corey Anderson – 23.33 Avg.points
- Harmeet Singh – 19.67 Avg.points
- Shadley van Schalkwyk – 9 Avg.points
- Jasdeep Singh – 19 Avg.points
- Saurabh Netravalkar – 46.67 Avg.points
- Ali Khan – 31.67 Avg.points
United States of America Team Squad –
- Top Order Batter – Shayan Jahangir, Steven Taylor, Andries Gous
- Middle Order Batter – Aaron Jones, Nitish Kumar, Corey Anderson, Harmeet Singh
- Bowler – Saurabh Netravalkar, Ali Khan, Jasdeep Singh, Shadley van Schalkwyk, Corey Anderson
South Africa (SA) Team Squad Analysis & Avg. Points/Match
- Quinton de Kock (WK) – 29 Avg.points
- Reeza Hendricks – 21.5 Avg.points
- Aiden Markram – 35.75 Avg.points
- Heinrich Klaasen – 31.25 Avg.points
- David Miller – 38.5 Avg.points
- Tristan Stubbs – 25.5 Avg.points
- Marco Jansen – 33.75 Avg.points
- Kagiso Rabada – 39 Avg.points
- Anrich Nortje – 72.75 Avg.points
- Ottniel Baartman – 46.75 Avg.points
- Tabraiz Shamsi – 142 Avg.points
South Africa Team Squad –
- Top Order Batter – Reeza Hendricks, Quinton de Kock, Aiden Markram
- Middle Order Batter – Heinrich Klaasen, David Miller, Tristan Stubbs, Marco Jansen
- Bowler – Marco Jansen, Kagiso Rabada, Ottniel Baartman, Anrich Nortje, Tabraiz Shamsi, Aiden Markram
USA vs SA Player Stats: United States of America Team Batting Stats in ICC Men’s T20 World Cup
MAT – Match, INNS – Innings, NO – Not Out, HS – Highest Score, AVG – Average, SR – Strike Rate
| Player | MAT | INNS | NO | RUNS | HS | AVG | BF | SR | 100s | 50s | 6s | 4s |
|---|---|---|---|---|---|---|---|---|---|---|---|---|
| 1. Aaron Jones | 3 | 4 | 2 | 152 | 94 | 76.00 | 94 | 161.70 | – | 1 | 13 | 7 |
| 2. Andries Gous | 3 | 3 | – | 102 | 65 | 34.00 | 77 | 132.47 | – | 1 | 4 | 12 |
| 3. Monank Patel | 2 | 2 | – | 66 | 50 | 33.00 | 54 | 122.22 | – | 1 | 1 | 9 |
| 4. Nitish Kumar | 3 | 2 | 1 | 41 | 27 | 41.00 | 37 | 110.81 | – | – | 1 | 3 |
| 5. Steven Taylor | 3 | 3 | – | 36 | 24 | 12.00 | 48 | 75.00 | – | – | 2 | 1 |
| 6. Corey Anderson | 3 | 2 | 1 | 18 | 15 | 18.00 | 17 | 105.88 | – | – | 1 | 1 |
| 7. Shadley van Schalkwyk | 2 | 1 | 1 | 11 | 11 | – | 10 | 110.00 | – | – | – | 1 |
| 8. Harmeet Singh | 3 | 2 | 1 | 10 | 10 | 10.00 | 10 | 100.00 | – | – | 1 | – |
| 9. Jasdeep Singh | 3 | 1 | – | 2 | 2 | 2.00 | 7 | 28.57 | – | – | – | – |
| 10. Shayan Jahangir | 1 | 1 | – | – | – | – | 1 | – | – | – | – | – |
USA vs SA Player Stats: United States of America Team Bowling Stats in ICC Men’s T20 World Cup
MAT – Match, INNS – Innings, OVR – Over, WK – Wicket, AVG – Average, SR – Strike Rate, ECN – Economy Rate, 4W – 4 Wicket, 5W – 5 Wicket, MD – Maiden Over
| Player | MAT | INNS | OVR | RUNS | WK | BBI | AVG | ECN | SR | 4W | 5W | MD |
|---|---|---|---|---|---|---|---|---|---|---|---|---|
| 1. Saurabh Netravalkar | 3 | 4 | 11 | 61 | 5 | 2/18 | 12.20 | 5.55 | 13.20 | – | – | – |
| 2. Nosthush Kenjige | 1 | 1 | 4 | 30 | 3 | 3/30 | 10.00 | 7.50 | 8.00 | – | – | – |
| 3. Ali Khan | 3 | 3 | 11.2 | 92 | 3 | 1/21 | 30.67 | 8.12 | 22.67 | – | – | – |
| 4. Corey Anderson | 3 | 3 | 7 | 52 | 1 | 1/29 | 52.00 | 7.43 | 42.00 | – | – | – |
| 5. Harmeet Singh | 3 | 2 | 8 | 61 | 1 | 1/27 | 61.00 | 7.63 | 48.00 | – | – | – |
| 6. Jasdeep Singh | 3 | 3 | 10 | 85 | 1 | 1/37 | 85.00 | 8.50 | 60.00 | – | – | – |
USA vs SA Player Stats: South Africa Team Batting Stats in ICC Men’s T20 World Cup
MAT – Match, INNS – Innings, NO – Not Out, HS – Highest Score, AVG – Average, SR – Strike Rate
| Player | MAT | INNS | NO | RUNS | HS | AVG | BF | SR | 100s | 50s | 6s | 4s |
|---|---|---|---|---|---|---|---|---|---|---|---|---|
| 1. David Miller | 4 | 4 | 2 | 101 | 59 | 50.50 | 105 | 96.19 | – | 1 | 5 | 5 |
| 2. Tristan Stubbs | 4 | 4 | 1 | 73 | 33 | 24.33 | 88 | 82.95 | – | – | 2 | 3 |
| 3. Heinrich Klaasen | 4 | 4 | 1 | 72 | 46 | 24.00 | 78 | 92.31 | – | – | 4 | 3 |
| 4. Reeza Hendricks | 4 | 4 | – | 50 | 43 | 12.50 | 62 | 80.65 | – | – | 1 | 6 |
| 5. Quinton de Kock | 4 | 4 | – | 48 | 20 | 12.00 | 49 | 97.96 | – | – | 3 | 2 |
| 6. Aiden Markram | 4 | 4 | – | 31 | 15 | 7.75 | 47 | 65.96 | – | – | 1 | 3 |
| 7. Marco Jansen | 4 | 3 | 1 | 9 | 5 | 4.50 | 14 | 64.29 | – | – | – | – |
| 8. Keshav Maharaj | 3 | 2 | 2 | 4 | 4 | – | 9 | 44.44 | – | – | – | – |
| 9. Kagiso Rabada | 4 | 1 | – | – | – | – | 1 | – | – | – | – | – |
| 10. Tabraiz Shamsi | 1 | – | – | – | – | – | – | – | – | – | – | – |
USA vs SA Player Stats: South Africa Team Bowling Stats in ICC Men’s T20 World Cup
MAT – Match, INNS – Innings, OVR – Over, WK – Wicket, AVG – Average, SR – Strike Rate, ECN – Economy Rate, 4W – 4 Wicket, 5W – 5 Wicket, MD – Maiden Over
| Player | MAT | INNS | OVR | RUNS | WK | BBI | AVG | ECN | SR | 4W | 5W | MD |
|---|---|---|---|---|---|---|---|---|---|---|---|---|
| 1. Anrich Nortje | 4 | 4 | 16 | 70 | 9 | 4/7 | 7.78 | 4.38 | 10.67 | 1 | – | – |
| 2. Ottniel Baartman | 4 | 4 | 16 | 67 | 5 | 4/11 | 13.40 | 4.19 | 19.20 | 1 | – | 1 |
| 3. Keshav Maharaj | 3 | 3 | 12 | 73 | 5 | 3/27 | 14.60 | 6.08 | 14.40 | – | – | – |
| 4. Tabraiz Shamsi | 1 | 1 | 4 | 19 | 4 | 4/19 | 4.75 | 4.75 | 6.00 | 1 | – | – |
| 5. Kagiso Rabada | 4 | 4 | 14 | 84 | 4 | 2/19 | 21.00 | 6.00 | 21.00 | – | – | 1 |
| 6. Marco Jansen | 4 | 4 | 15.1 | 68 | 2 | 2/20 | 34.00 | 4.48 | 45.50 | – | – | – |
| 7. Aiden Markram | 4 | 1 | 2 | 8 | 1 | 1/8 | 8.00 | 4.00 | 12.00 | – | – | – |
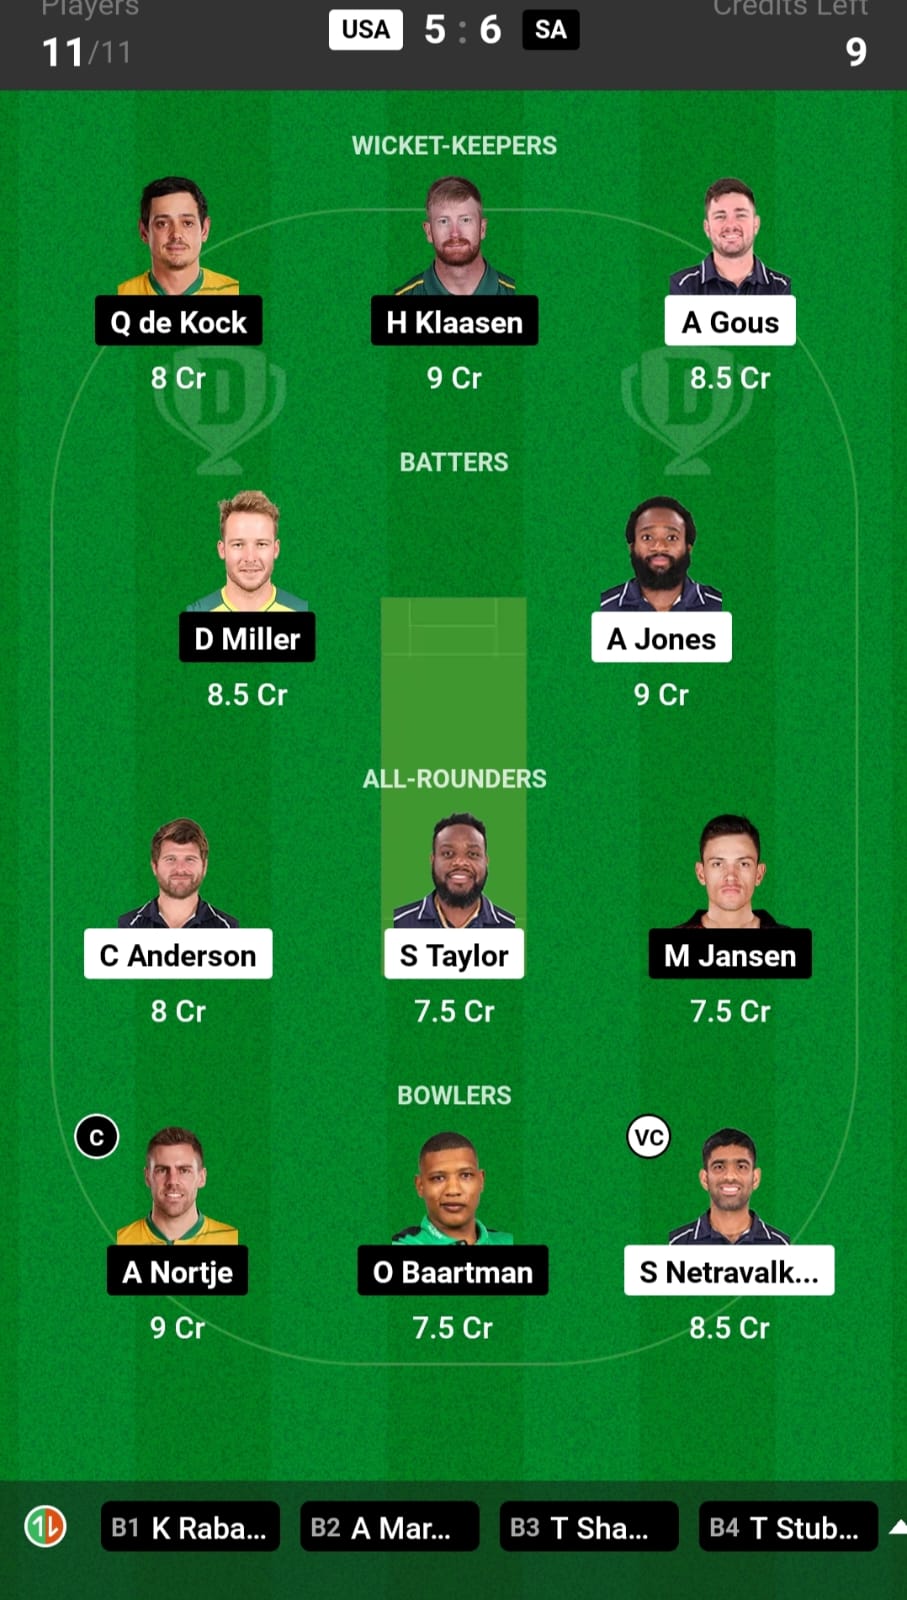
USA vs SA Dream11 Prediction, 39th Match, T20 World Cup, 2024

Play on Vision11 = Get 100₹ Real Cash
| Get an Expert Fantasy Team After the toss only on |
| MyFinal11 Telegram Channel MyFinal11 WhatsApp Channel |
[ninja_table_builder id=”141500″]
Disclaimer:
- Myfinal11 doesn’t guarantee the participant of win rewards/prizes based on any information mentioned in the Fantasy Expert Tips. Information provided is purely based on expert insights and data and is independent of the upcoming player performances.
- MyFinal11 bears no responsibility towards points/rewards/prizes the participant may win while playing Fantasy Cricket or any other such game.
- Content mentioned in the Fantasy Tips is subject to change based on factors like changes in weather, injury, etc.
- The contents of this page are updated until the start of the match.


